Equilibrium
If no interference in the market occurs, price will eventually settle at the level where quantity demanded equals quantity supplied. This position, where there is no tendency for prices to change, is called the market equilibrium.
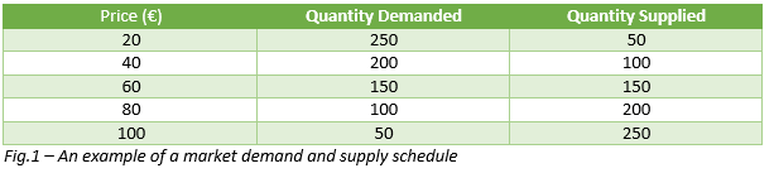
To find the market equilibrium we must make a market demand and supply schedule. Fig.1
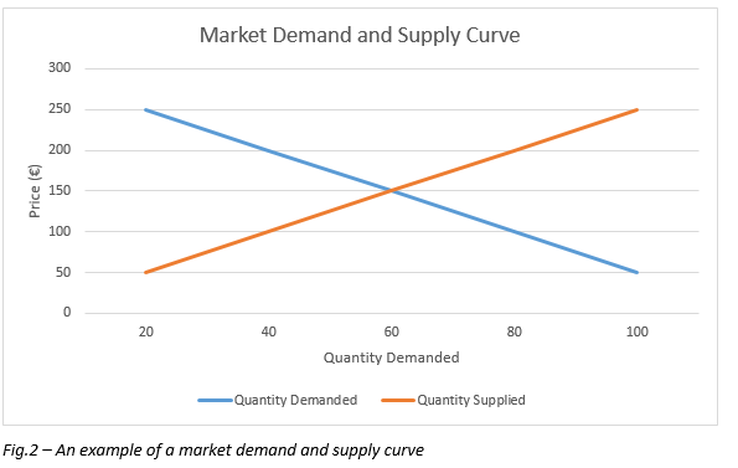
We then use this to plot a demand curve and a supply curve. The point of intersection of these curves is the market equilibrium. Fig. 2
To find the market equilibrium we must make a market demand and supply schedule. Fig.1
We then use this to plot a demand curve and a supply curve. The point of intersection of these curves is the market equilibrium. Fig. 2
·If quantity supplied exceeds the quantity demanded, producers will lower the price to get rid of surplus stock.
·If the quantity demanded exceeds the quantity supplied, scarcity would exist and price would increase.
Equilibrium price is the price that balances quantity supplied and quantity demanded.
Equilibrium quantity is the quantity supplied and demanded at the equilibrium price.
Surplus is a situation in which quantity supplied is greater that quantity demanded.
Shortage is a situation in which quantity demanded is greater that quantity supplied.
What happens when price is not at equilibrium?
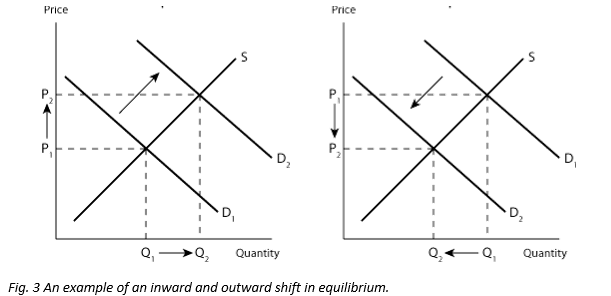
· If the supply is greater than demand then there is an excess in supply. The price needs to fall in order to sell this excess in supply.
· If demand is greater than supply then there is an excess in demand. The price is then risen. Fig.3
·If the quantity demanded exceeds the quantity supplied, scarcity would exist and price would increase.
Equilibrium price is the price that balances quantity supplied and quantity demanded.
Equilibrium quantity is the quantity supplied and demanded at the equilibrium price.
Surplus is a situation in which quantity supplied is greater that quantity demanded.
Shortage is a situation in which quantity demanded is greater that quantity supplied.
What happens when price is not at equilibrium?
· If the supply is greater than demand then there is an excess in supply. The price needs to fall in order to sell this excess in supply.
· If demand is greater than supply then there is an excess in demand. The price is then risen. Fig.3
Supply and demand curves are used to analyse how any event can influence the market and show how it affects the equilibrium price and quantity. We follow three steps to illustrate these changes:
1. We see whether the event cause a shift in either the supply curve or the demand curve.
2. We then decide which direction the curve shifts.
3. Finally, we analyse the new equilibrium price and quantity and compare them to the initial equilibrium.
1. We see whether the event cause a shift in either the supply curve or the demand curve.
2. We then decide which direction the curve shifts.
3. Finally, we analyse the new equilibrium price and quantity and compare them to the initial equilibrium.
Bibliography
Hayes, S, Murray, T, O'Connor, B (2012). Positive Economics Leaving Certificate. Dublin: Edco. 22-58.
Mankiw, G, Taylor, M (2011). Economics. 2nd ed. United Kingdom: South-Western Cengage Learning. 68-94.
Mankiw, G, Taylor, M (2011). Economics. 2nd ed. United Kingdom: South-Western Cengage Learning. 68-94.
